About Statistical Tables Plus 5.7
Statistical Tables Plus Version 5.7 Value packed combination of Probability Distribution Tables, plus commonly used statistical inference tests. Updated UI. Inference Test Formulas added for one and two population
Statistical Tables Plus Version 5.7
Value packed combination of Probability
Distribution Tables, plus commonly used
statistical inference tests.
Updated UI. Inference Test Formulas
added for one and two population means.
Convenient, Accurate, Easy to Read
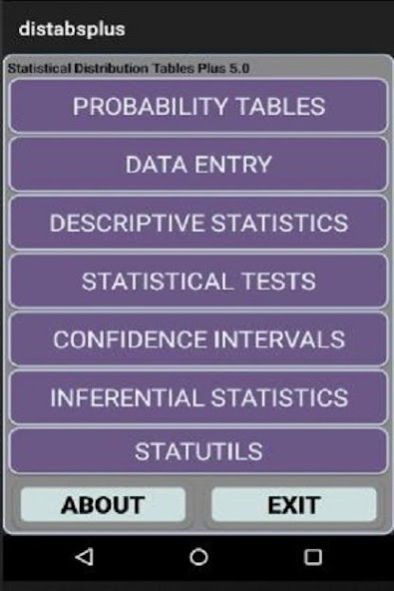
electronic Probability Distribution Tables.
Commonly used statistical inference tests.
Confidence Interval calculation.
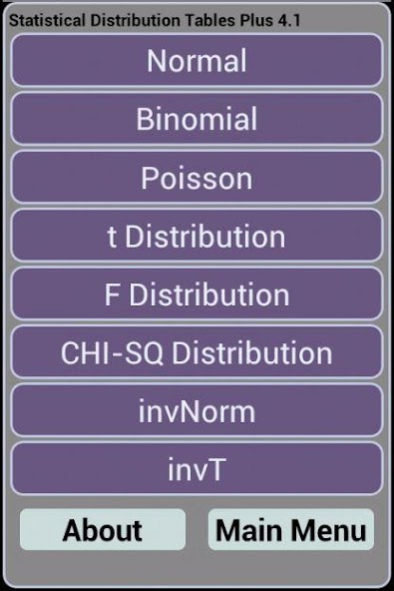
Contains Normal, Binomial, Poisson, T, F and Chi-Square
Probability Distributions. Also, invNorm and
invT calculations.
Data entry for 10 variables.
Descriptive Statistics. (Added Percentiles,
Skewness and Kurtosis).
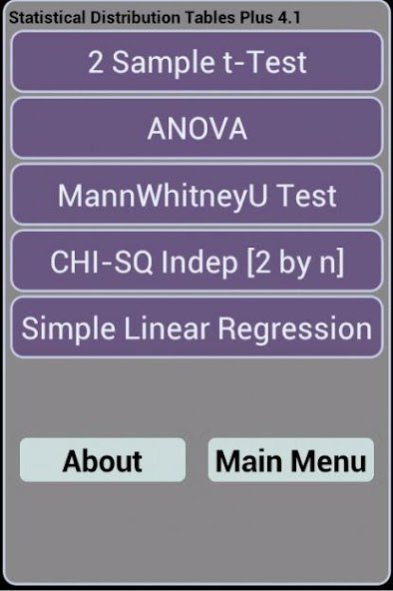
Statistical Tests Including t-test, ANOVA,
MannWhitneyU Test, Chi-Square Test,
Simple Linear Regression.
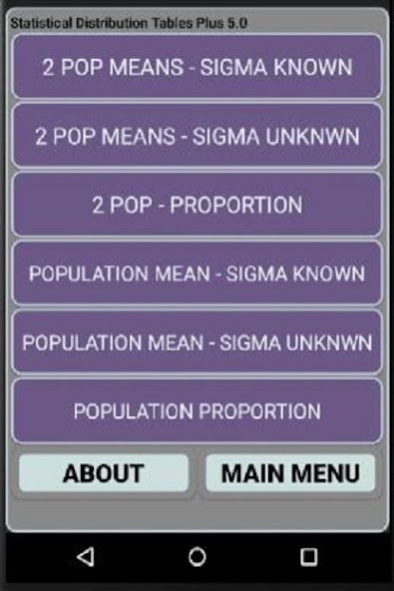
Contains calculators for Confidence
Intervals (Sigma Known, Sigma Unknown,
Proportion), Permutations and Combinations.
Great for Intro Probability Statistics
courses, or if you just need these tables!
For both Phone and 10' tablets.
These tables give you the probabilities
associated with your test statistics and
parameters.
To use these tables, just select the
distribution you want, and put in the
test statistic and parameters, and the
APP tells you the related probability.
*************************************
1) For the Normal Probability Distribution:
Enter your Z Score, and you get
the left, right tails and the range.
2) For the Binomial Probability Distribution:
Enter n - number of trials,
p - probability of success,
x - number of successes
and you get the probability of
x, or the cumulative probability
for x.
3) For the Poisson Probability Distribution:
Enter the mean, and number of
occurences, and you will get
the Probability of the number
of occurences, and the cumulative
probability.
4) For the t Probability Distribution:
Enter t and the Degrees of Freedom
and you will get the probability
of the left and right tails, and
the two tailed probability.
5) For the f Probability Distribution:
Enter the f statistic, and the
Degrees of Freedom for the numerator
and denominator. You will get the
probability for the right tail
(alpha for the ANOVA test).
6) For the Chi-Square Probability Distribution:
Enter Chi-Square and the Degrees of Freedom
and you will get the probability
of the right tail.
7) Inverse Normal Probability Distribution.
Enter the probability of the
Normal Distribution left tail,
and you get the Z statistic.
8) Inverse t Probability Distribution
Enter the probability of the
t distribution left tail, along with
the degrees of freedom, and you will
get the t statistic.
Confidence Intervals:
Sigma Known. Uses the standard
CI formula (Using Z) to determine the range with
CI% chance of containing the true mean
of the population.
Sigma unKnown. Uses the standard
CI formula (Using t) to determine the range with
CI% chance of containing the true mean
of the population.
CI for a proportion. Uses the standard
CI formula (Using p,n,Z) to determine the range with
CI% chance of containing the true mean
of the population.
Statistical Utilities:
Permutations and Combinations give number
of ways to select n Items out of N Items.
In Permutations Order of selected Items matters,
in Combinations it does not. Sampling is
without replacement.
Sample size n, is number needed for CI with
following parameters:
alpha - CI between 0 and 1.0
sigma - Known standard deviation.
E - desired error.
Formula is: n = (Z^2 * s^2) / E^2
Z is Z score for (1-alpha)/2
Includes 5 common statistical tests,
and Descriptive Statistics.
Help for each test is included in
the APP.
Inferential Statistics Formulas:
Difference between 2 Population Means.
Hypothesis Test Mean.
Proportions.
Free!. Please visit this APP in
the Google Play store to Rate and
enter comments. This will help us
improve the APP over time.
Due care has been taken for accurate results.
This APP is for educational use.
However, no warrenty against any damages due to
use is included or implied.